Contents
- Customer List Report
- Customer Group Report
- Sales History Summary
- Sales Activity Report
- Aged Receivables
- Overdue Invoices
- Item Sales History
- Customer Item Report
- Customer Map
- Stock On Hand
- *Important notice
Related Documents
Xact Link for ACT! and QuickBooks Reporting Overview
Customer List Report
Overview
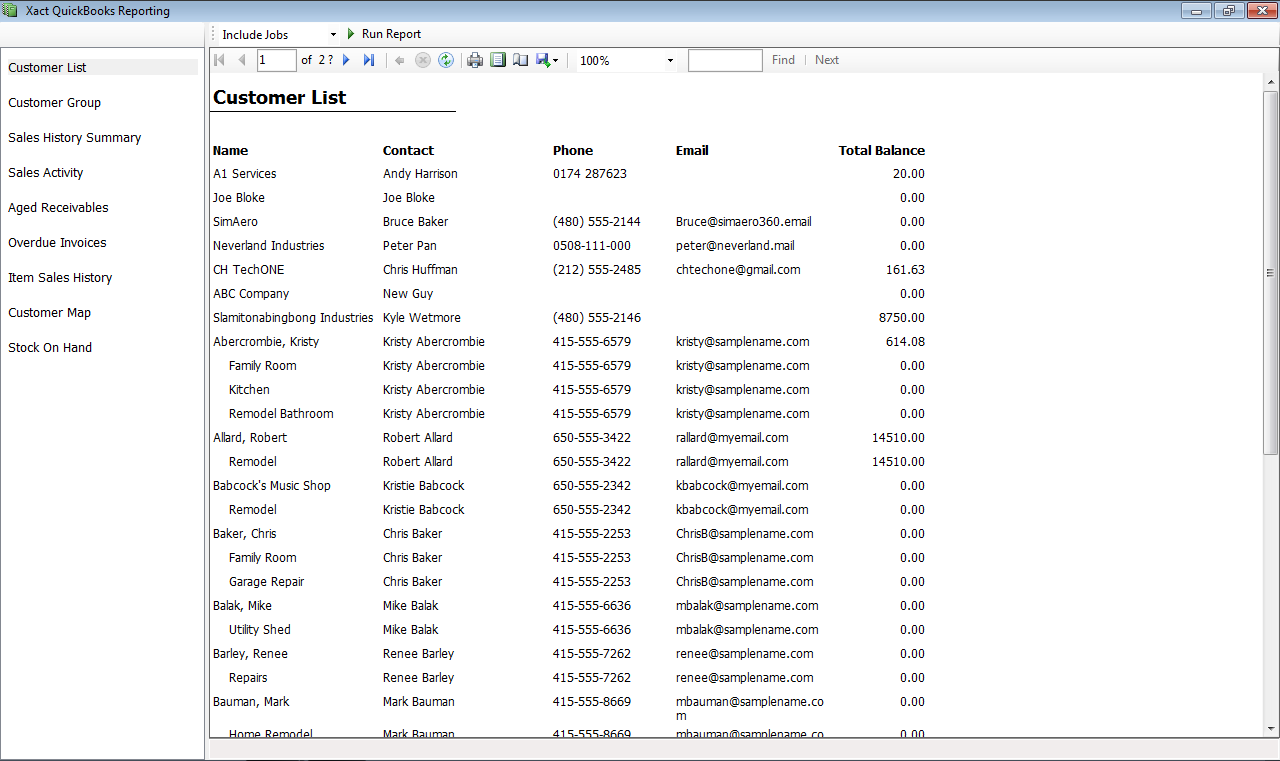
This report generates a list of all your QuickBooks customers. This list can include or exclude QuickBooks Jobs and users can also perform a keyword search.
The results of this report are displayed in a table that shows the Customer Name, Contact Person, Phone Number, Email Address and Total Balance.
This list can then be printed or exported to Excel, PDF, or Word format.
Example: A report that shows all QuickBooks customers, including jobs.
The Query will look like this:

The report will look like this:
Customer Group Report
This report enables users to generate a list of customers based on their account information. The criteria that users can search on are: Customer Type, Sales Terms and Sales Rep.
The results of this report are displayed in a table that shows the Account Name, Company, Contact Person, Phone Number, Email Address, Customer Type, Sales Terms, Sales Rep and Notes.
This report can be exported to CSV, turned into an ACT! Lookup and/or added to a new or existing ACT! Group.*
Example: A report that shows all Residential customers with sales terms of Net 15
The Query will look like this:

The report will look like this:
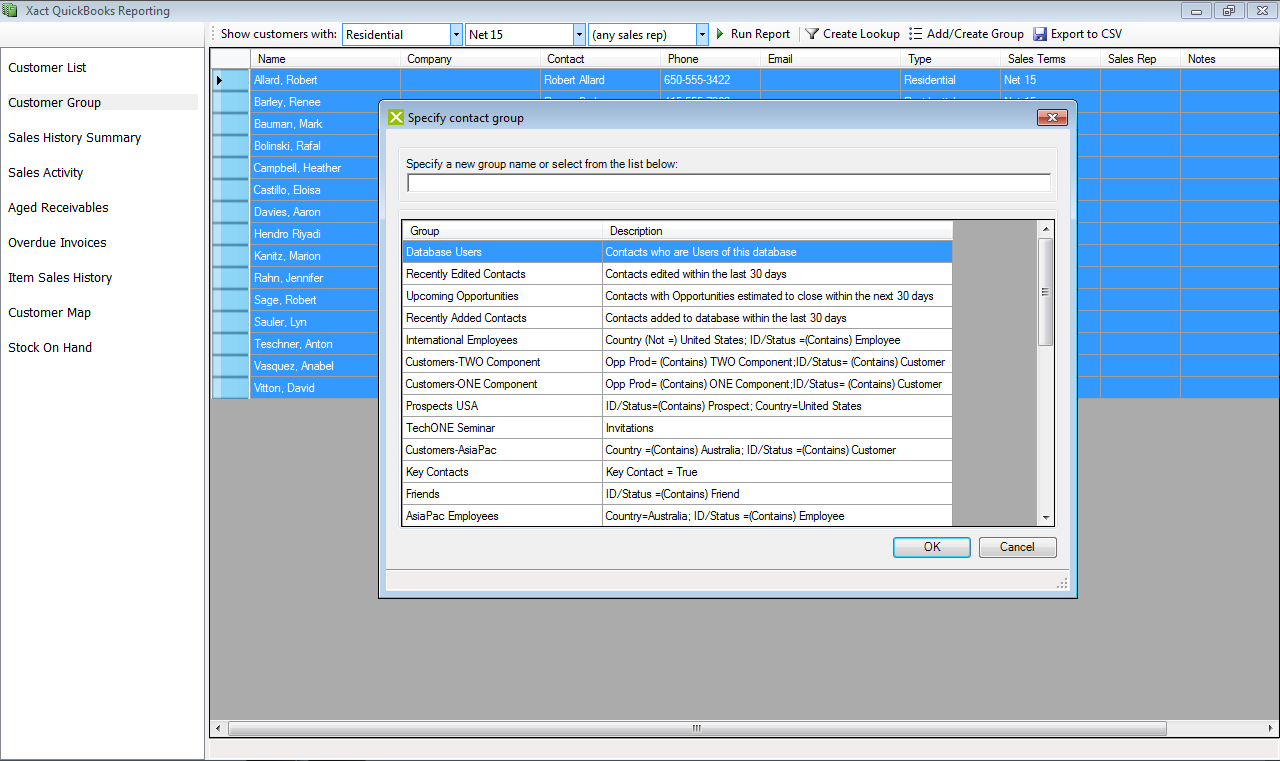
Note: This report shows the step where you can add the linked contacts to a new or existing group in ACT!
Sales History Summary
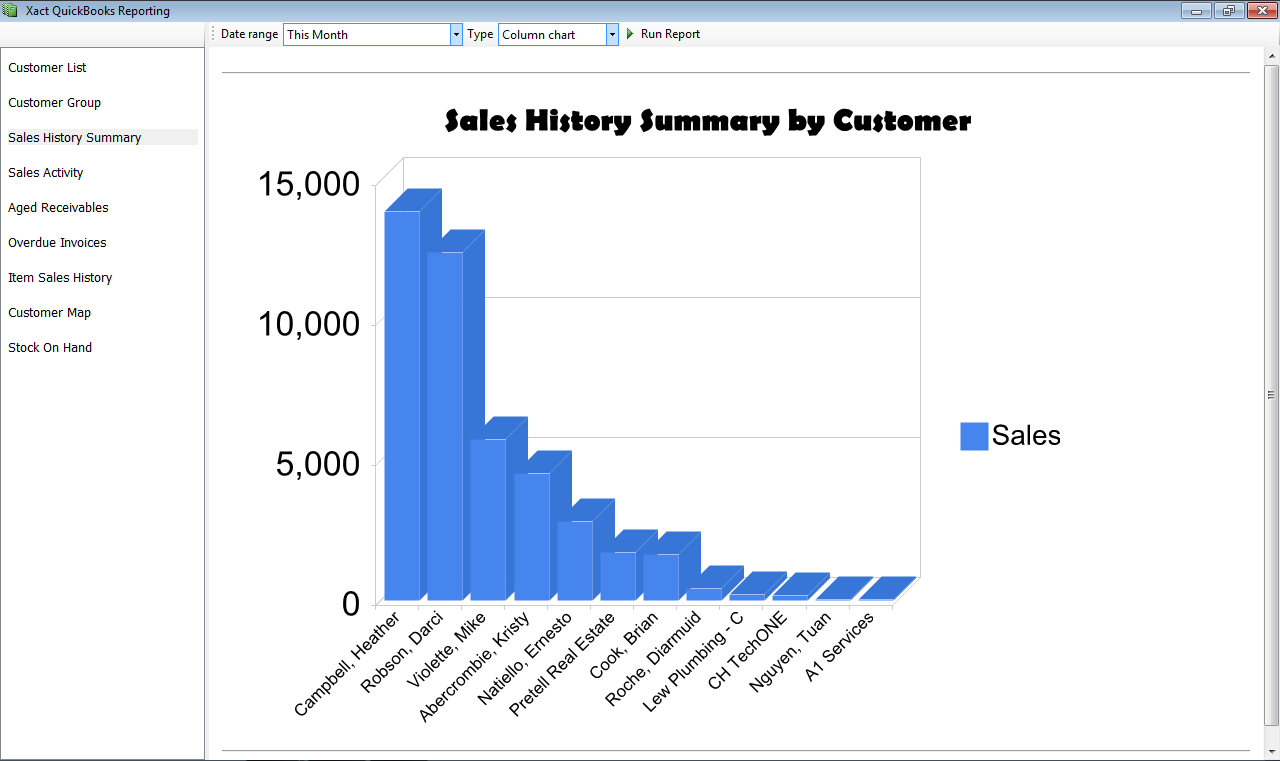
With this report users can perform a lookup of all the customers they sold to in a particular date range. There are over 30 default date ranges for users to choose from including This Month, This Fiscal Quarter, and This Calendar Year to Date, or users can enter a custom date range.
Users have the option to display the results in Pie Chart, Column Chart or Table format.
Example: A report that shows all of the customers who purchased from us in the last month, displayed as a column chart.
The Query will look like this:

The report will look like this:
Sales Activity Report
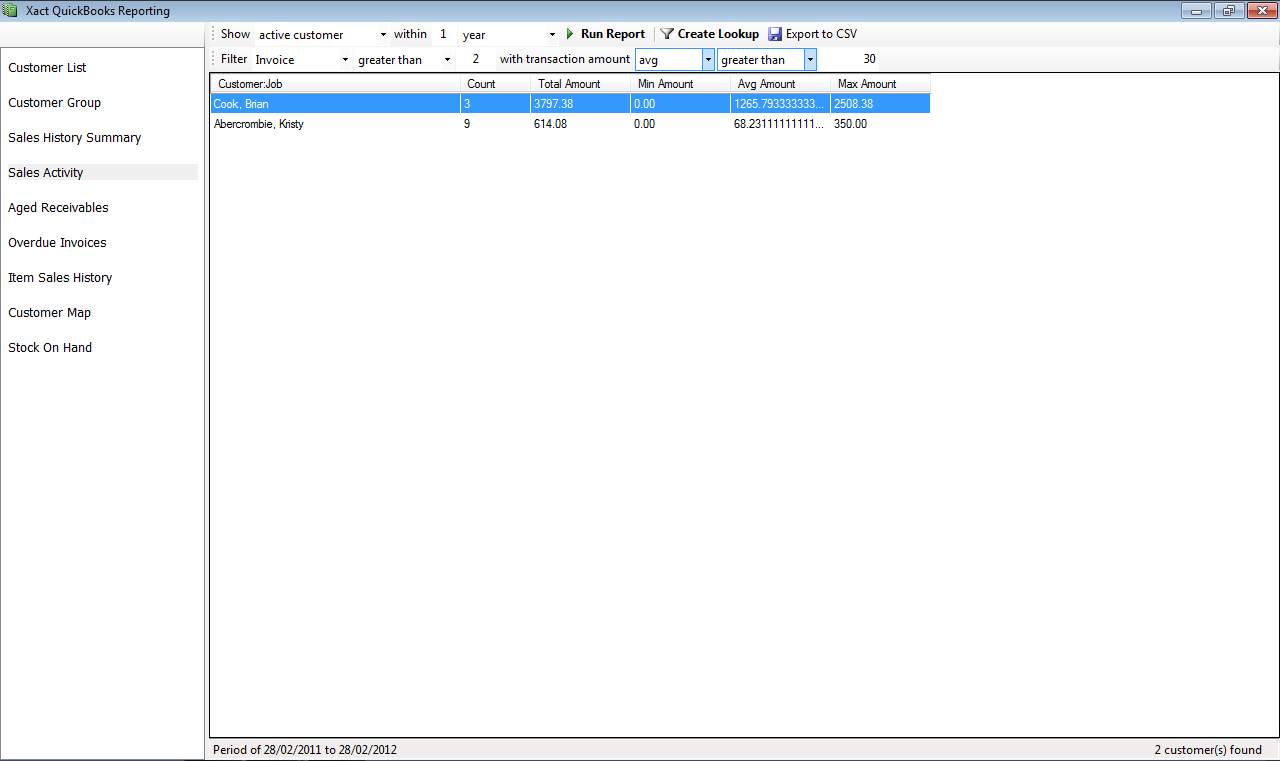
This is a somewhat complex report that enables users to segment customers by sales history. This report shows active or inactive customers within a particular time frame (e.g. 1 year). Users can then filter based on the number of sales documents and transaction values.
The results are displayed in a table that shows: Customer: Job, Count, Total Amount, Min Amount, Avg Amount, and Max Amount.
This report can be exported to CSV or turned into an ACT! Lookup.*
Example: A report that shows customers who purchase often (e.g. more than 2 invoices in the past year) and, on average, spend more than $30.
The Query will look like this:

The report will look like this:
Aged Receivables
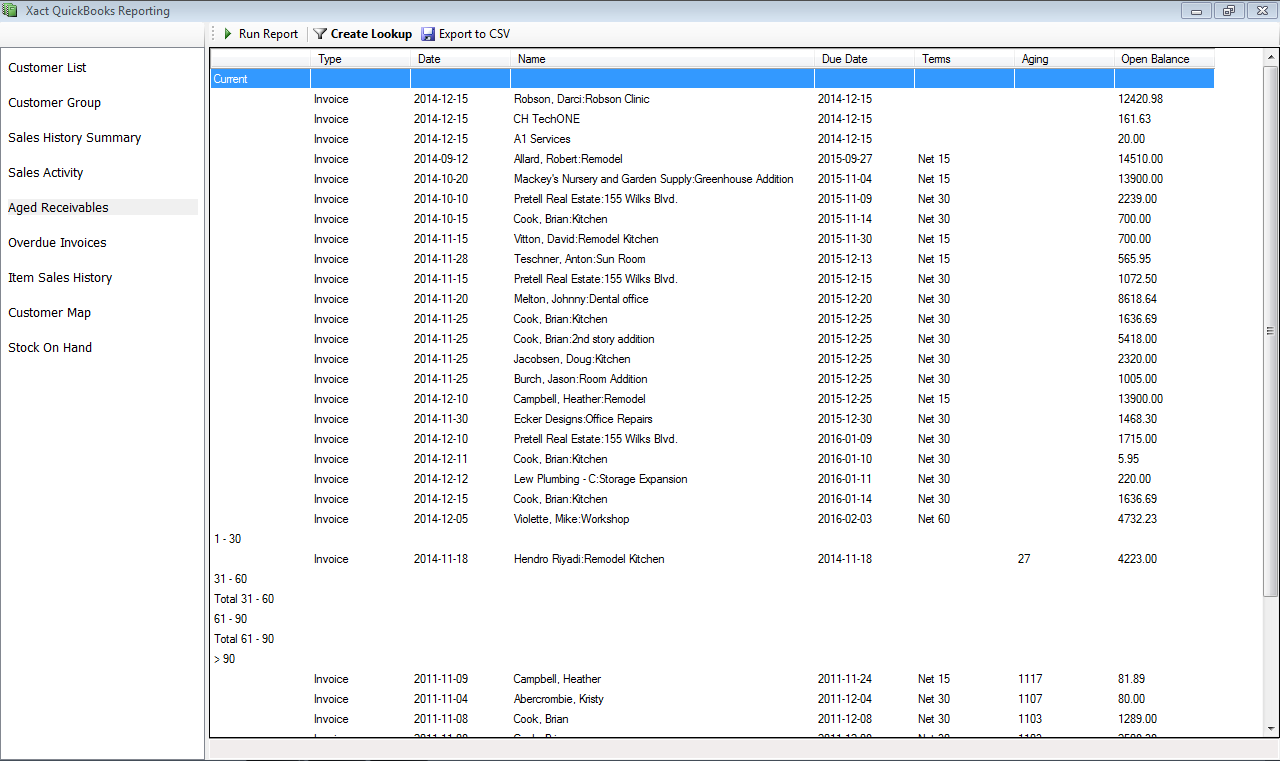
The Aged Receivables report pulls a list of all your current and overdue invoices from QuickBooks.
When the report is generated it organises the results according to the age of the receivables (i.e. current, 1-30 days, 31-60 days, 61-90 days and 91+ days).
Users can then export the list to CSV or perform an ACT! Lookup.*
Example: A report showing all Aged Receivables.
The report will look like this:
Overdue Invoices
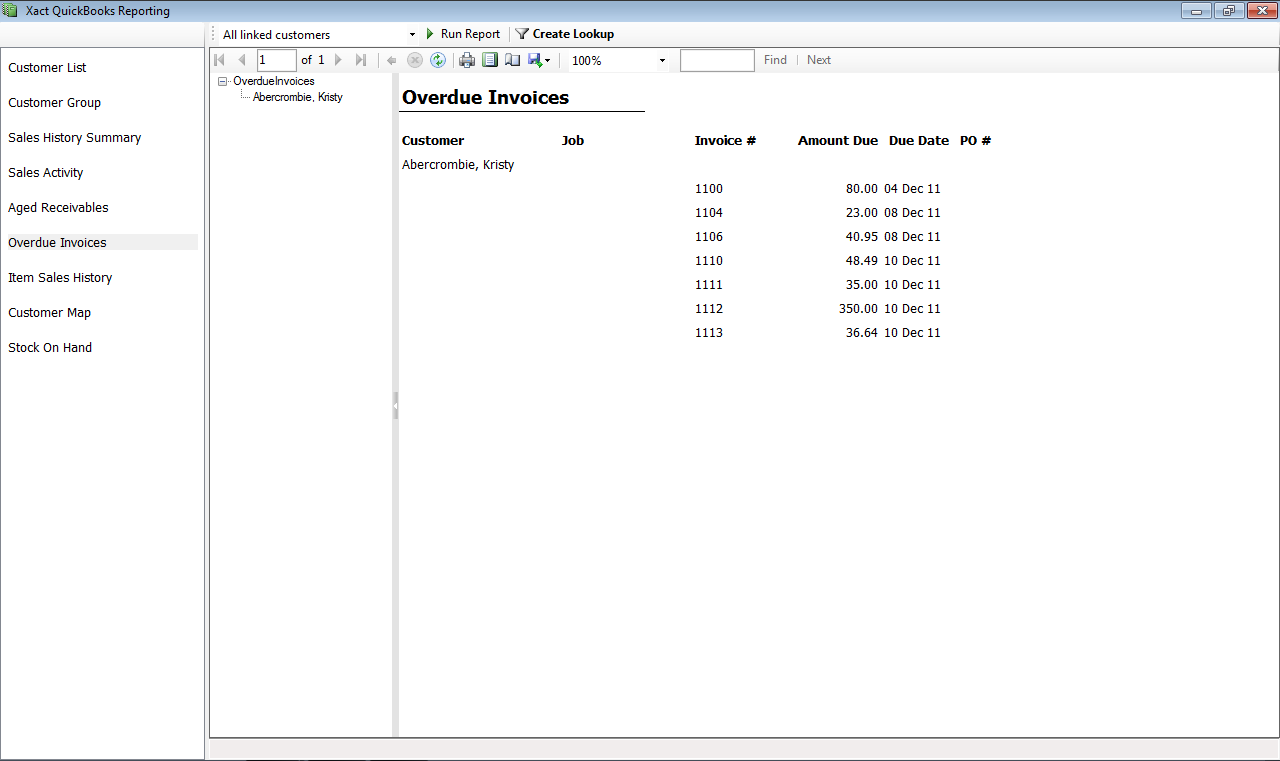
This report pulls a list of QuickBooks customers that are linked to ACT! Records and have overdue invoices. Once the report has been generated, users can also perform a keyword search.
The results of this report are displayed with a column on the left which lists all the customers with overdue invoices, and a details section on the right which provides specific information about a selected customer including the Invoice Numbers, Amount Due and Due Date of all the overdue Invoices.
This report can then be converted into an ACT! Lookup, printed, and/or exported to Excel, PDF or Word.*
Example: A report that shows overdue invoices for all linked customers in ACT!
The report will look like this:
Item Sales History
This report enables users to view the sales history for an item category or specific item/s. Users can filter these results by date range (using a pre-defined or custom date range) and customer.
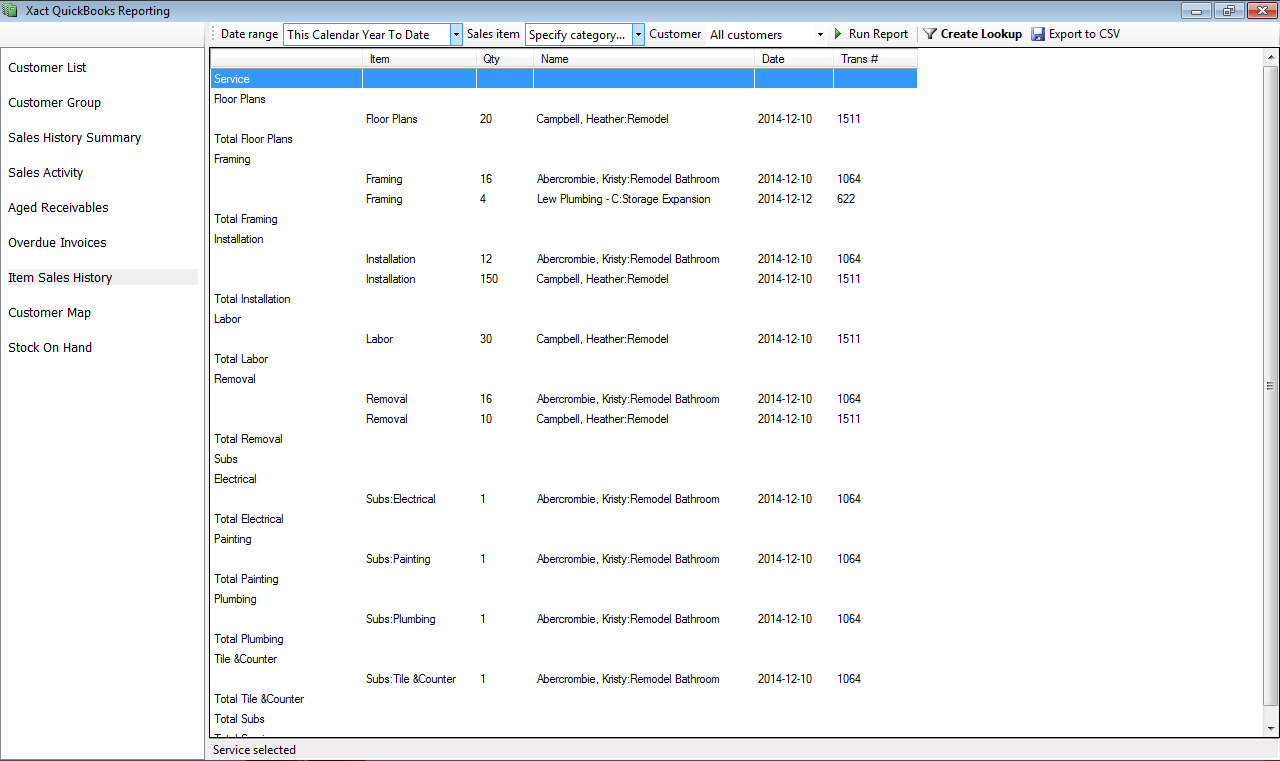
The results are displayed in a table that shows: Item Name, Quantity Sold, Job Name, Date of Sale and Transaction Number.
Once the report has been generated users can export the results to CSV or Create an ACT! Lookup.*
Example: A report that shows all of the “Service” sales in this calendar year to date.
The Item Category selection will look like this:
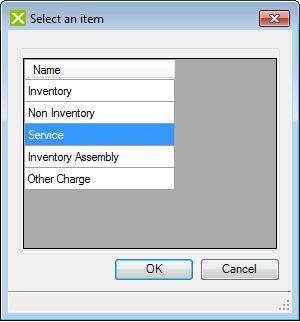
The report will look like this:
Customer Item Report
This report enables users to view item sales for a particular customer across a date range and within a sales document type (i.e. Estimate, Sales Order, Sales Invoice or Sales Receipt).
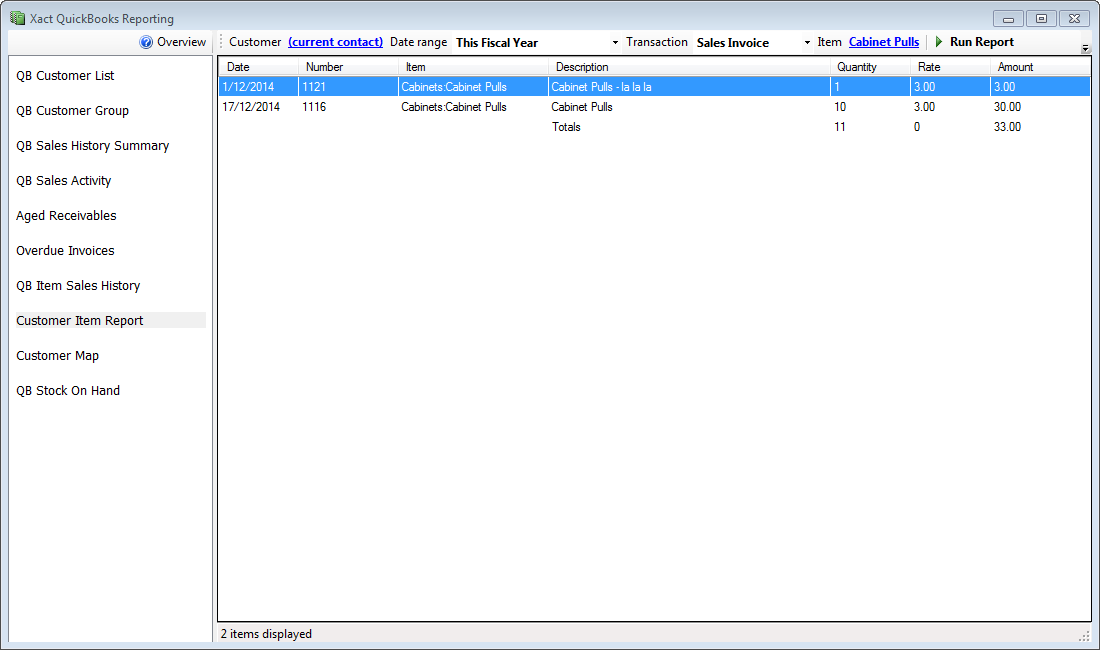
The results are displayed in a table that shows: Date, Number, Item Name, Description, Quantity, Rate and Total Amount.
Example: A report that shows all of the Cabinet Pulls CH TechONE have been invoiced during this fiscal year.
The Query will look like this:

The report will look like this:
Customer Map
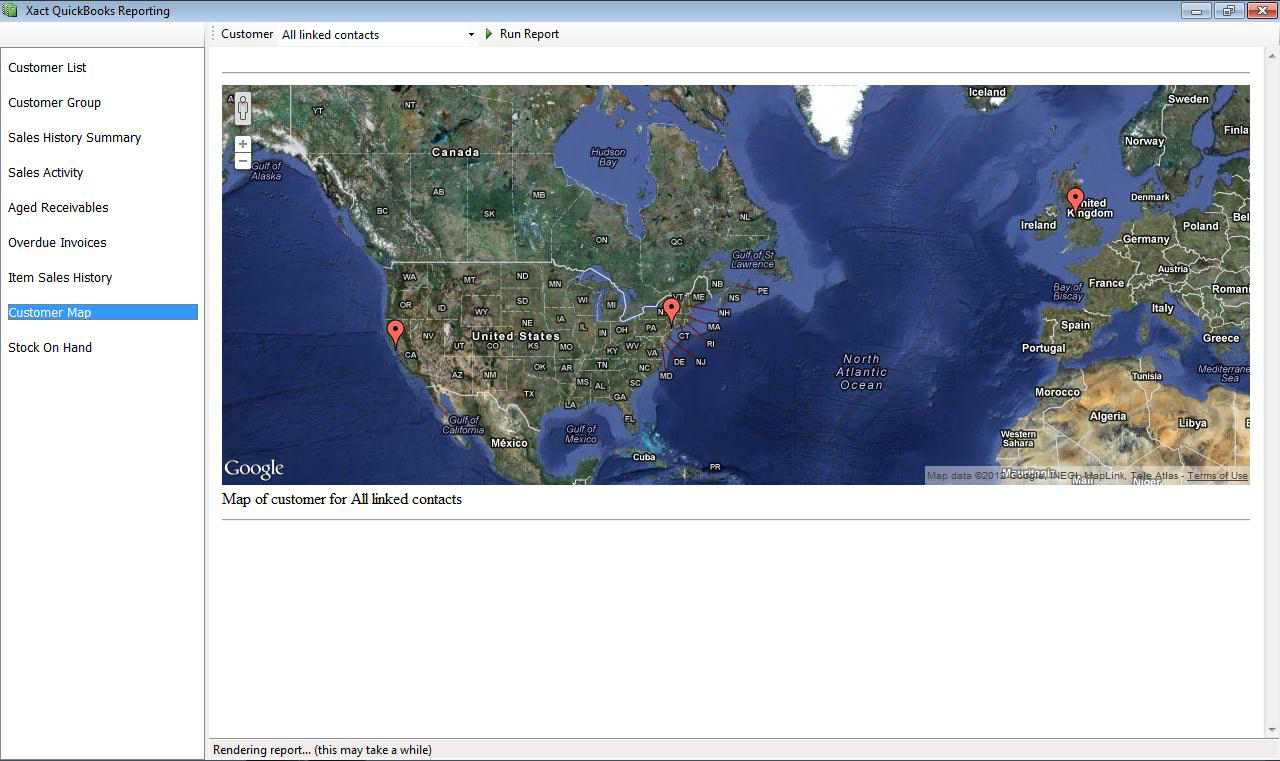
This report generates a Google Map image and places your customers according to their geographic location. You can choose to show all linked contacts, linked contacts in current lookup, all (ACT!) contacts and all (ACT!) contacts in the current lookup.
Example: A Google map that shows all linked customers.
The report will look like this:
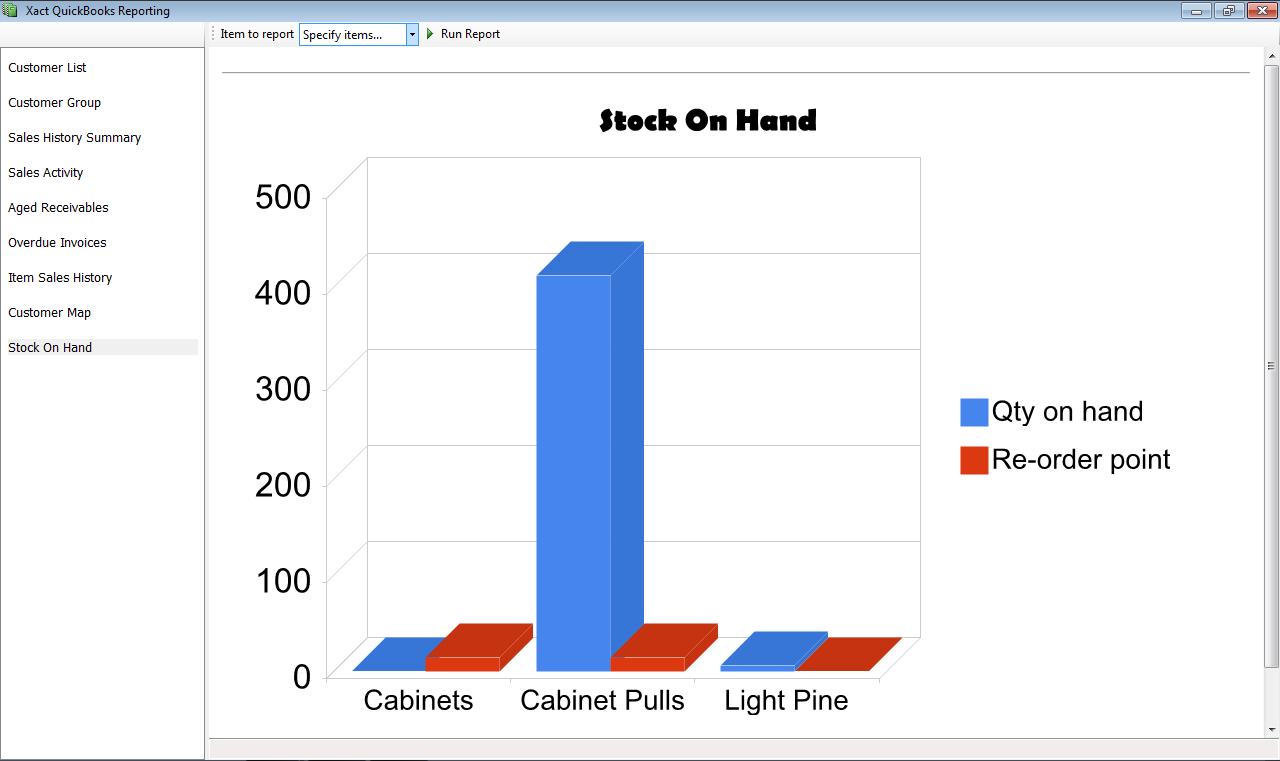
Stock On Hand
Overview: This report generates a Column Chart displaying the current quantity on hand and re-order points for all or specific items.
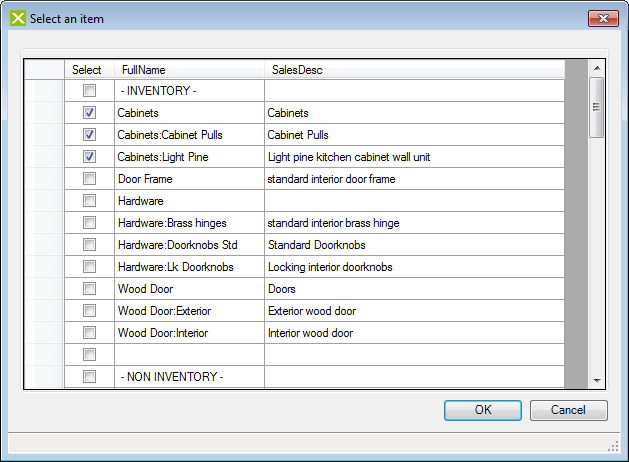
Example: A report that shows the stock on hand for Cabinets, Cabinet Pulls and Lite Pine Cabinets.
The Item selection will look like this:
The report will look like this:
*Important notice
Some reports allow you to turn the results into ACT! lookups and/or ACT! groups.
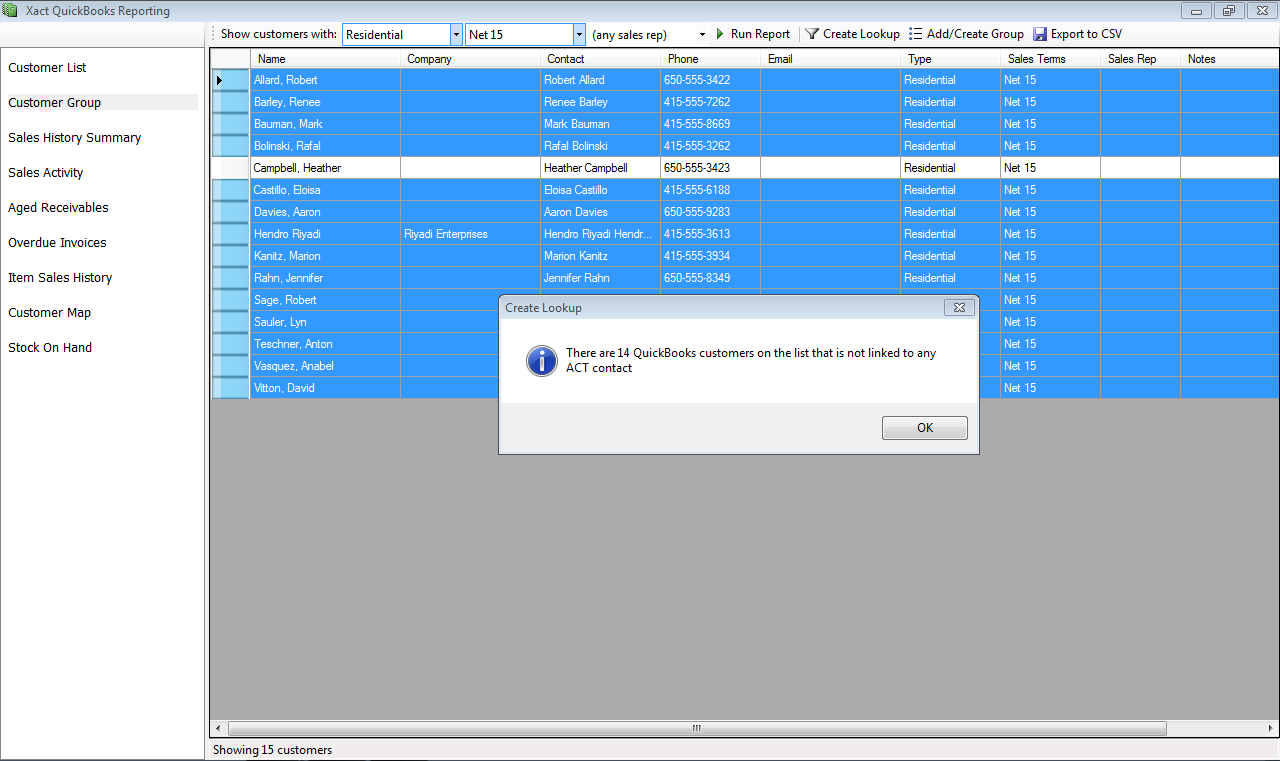
Only customers who have linked records in ACT! can be turned into a lookup or added to an ACT! Group. Once you choose to create an ACT! lookup the link will notify you of how many records are in the lookup (i.e. how many QuickBooks customers are linked to ACT! records) and will also highlight the customers, in the report, that aren’t linked to a record in ACT!
For example: This list below contains 14 QuickBooks customers (highlighted) that are not linked to records in ACT! These records will not appear in the ACT! lookup.